| Name: SMTNL1 | Sequence: fasta or formatted (512aa) | NCBI GI: 157738619 | |
|
Description: smoothelin-like 1
|
Referenced in:
| ||
|
Composition:
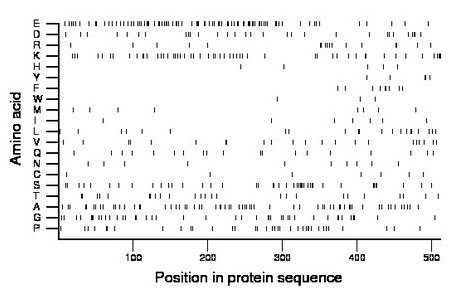
Amino acid Percentage Count Longest homopolymer A alanine 12.5 64 2 C cysteine 1.4 7 1 D aspartate 5.9 30 2 E glutamate 16.4 84 3 F phenylalanine 1.8 9 2 G glycine 8.2 42 3 H histidine 1.0 5 1 I isoleucine 1.4 7 1 K lysine 10.5 54 3 L leucine 4.1 21 2 M methionine 1.8 9 1 N asparagine 2.0 10 1 P proline 7.0 36 2 Q glutamine 3.7 19 1 R arginine 3.3 17 2 S serine 8.4 43 3 T threonine 4.9 25 2 V valine 4.3 22 2 W tryptophan 0.6 3 1 Y tyrosine 1.0 5 1 |
Comparative genomics:
Search single species RefSeq proteins at NCBI
Search summary 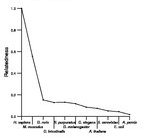
Figure data | ||
Related human proteins:Protein Relative score Description Self-match 1.000 smoothelin-like 1 SMTN 0.180 smoothelin isoform b SMTN 0.149 smoothelin isoform c SMTN 0.145 smoothelin isoform a SMTNL2 0.140 smoothelin-like 2 isoform 2 SMTNL2 0.140 smoothelin-like 2 isoform 1 EHBP1L1 0.083 tangerin CYTSA 0.082 cytospin A CYTSA 0.082 cytospin A RPGR 0.072 retinitis pigmentosa GTPase regulator isoform C [Hom... CYTSB 0.072 spectrin domain with coiled-coils 1 NSP5a3b CYTSB 0.072 spectrin domain with coiled-coils 1 NSP5b3b NEFH 0.069 neurofilament, heavy polypeptide 200kDa EHBP1 0.068 EH domain binding protein 1 isoform 1 ACTN3 0.068 actinin, alpha 3 EHBP1 0.068 EH domain binding protein 1 isoform 3 EHBP1 0.068 EH domain binding protein 1 isoform 3 EHBP1 0.068 EH domain binding protein 1 isoform 2 ACTN1 0.068 actinin, alpha 1 isoform c ACTN1 0.068 actinin, alpha 1 isoform a ACTN1 0.068 actinin, alpha 1 isoform b NEFM 0.067 neurofilament, medium polypeptide 150kDa isoform 1 ... NEFM 0.067 neurofilament, medium polypeptide 150kDa isoform 2 ... SPTBN5 0.066 spectrin, beta, non-erythrocytic 5 ACTN2 0.064 actinin, alpha 2 SPTBN4 0.063 spectrin, beta, non-erythrocytic 4 isoform sigma1 [... SPTB 0.062 spectrin beta isoform a SPTB 0.062 spectrin beta isoform b ACTN4 0.062 actinin, alpha 4 MICALL1 0.061 molecule interacting with Rab13Human BLASTP results (used to prepare the table) | |||
Gene descriptions are from NCBI RefSeq. Search results were obtained with NCBI BLAST and RefSeq entries. When identical proteins are present, the self-match may not be listed first in BLASTP output. In such cases, the table above has been reordered to place it first.
See About the Figures for the scoring system used in the figure above right. The same scoring system was used in the table of BLASTP results.
Guide to the Human Genome
Copyright © 2010 by Stewart Scherer. All rights reserved.
