| Name: TBRG1 | Sequence: fasta or formatted (411aa) | NCBI GI: 170650705 | |
|
Description: transforming growth factor beta regulator 1
| Not currently referenced in the text | ||
|
Composition:
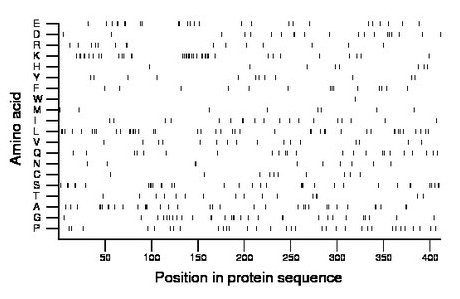
Amino acid Percentage Count Longest homopolymer A alanine 8.5 35 3 C cysteine 2.4 10 1 D aspartate 4.9 20 2 E glutamate 6.3 26 2 F phenylalanine 3.4 14 2 G glycine 7.3 30 2 H histidine 1.9 8 1 I isoleucine 4.6 19 2 K lysine 9.2 38 4 L leucine 10.5 43 2 M methionine 1.9 8 1 N asparagine 2.4 10 2 P proline 8.0 33 1 Q glutamine 5.6 23 1 R arginine 3.6 15 2 S serine 8.3 34 3 T threonine 3.9 16 2 V valine 3.9 16 1 W tryptophan 0.2 1 1 Y tyrosine 2.9 12 1 |
Comparative genomics:
Search single species RefSeq proteins at NCBI
Search summary 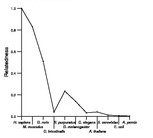
Figure data | ||
Related human proteins:Protein Relative score Description Self-match 1.000 transforming growth factor beta regulator 1 MLL2 0.057 myeloid/lymphoid or mixed-lineage leukemia 2 MLL3 0.051 myeloid/lymphoid or mixed-lineage leukemia 3 INO80E 0.020 INO80 complex subunit E MLL 0.019 myeloid/lymphoid or mixed-lineage leukemia protein [... SRRM1 0.015 serine/arginine repetitive matrix 1 PROCA1 0.014 protein interacting with cyclin A1 MLL4 0.012 myeloid/lymphoid or mixed-lineage leukemia 4 EML4 0.012 echinoderm microtubule associated protein like 4 iso... C9orf86 0.011 Rab-like GTP-binding protein 1 isoform 1 TAF3 0.010 RNA polymerase II transcription factor TAFII140 [Ho... TENC1 0.010 tensin like C1 domain containing phosphatase isoform... TENC1 0.010 tensin like C1 domain containing phosphatase isoform... TENC1 0.010 tensin like C1 domain containing phosphatase isoform... EIF5B 0.010 eukaryotic translation initiation factor 5B PSMD7 0.010 proteasome 26S non-ATPase subunit 7 NOP56 0.009 nucleolar protein 5A NAV1 0.009 neuron navigator 1 LOC100289473 0.009 PREDICTED: hypothetical protein XP_002344218 CAGE1 0.007 cancer antigen 1 LOC100294049 0.007 PREDICTED: similar to hCG2019710 LOC100294364 0.007 PREDICTED: hypothetical protein LOC100291000 0.007 PREDICTED: hypothetical protein XP_002348043 FAM161A 0.007 hypothetical protein LOC84140 ATXN7L2 0.007 ataxin 7-like 2 CEP120 0.007 coiled-coil domain containing 100 FAM63B 0.007 hypothetical protein LOC54629 isoform a FAM63B 0.007 hypothetical protein LOC54629 isoform b TBC1D10B 0.006 TBC1 domain family, member 10B DSP 0.006 desmoplakin isoform IHuman BLASTP results (used to prepare the table) | |||
Gene descriptions are from NCBI RefSeq. Search results were obtained with NCBI BLAST and RefSeq entries. When identical proteins are present, the self-match may not be listed first in BLASTP output. In such cases, the table above has been reordered to place it first.
See About the Figures for the scoring system used in the figure above right. The same scoring system was used in the table of BLASTP results.
Guide to the Human Genome
Copyright © 2010 by Stewart Scherer. All rights reserved.
