| Name: SIRT2 | Sequence: fasta or formatted (389aa) | NCBI GI: 13775600 | |
|
Description: sirtuin 2 isoform 1
|
Referenced in: Histones, Related Proteins, and Modifying Enzymes
| ||
Other entries for this name:
alt prot [352aa] sirtuin 2 isoform 2 | |||
|
Composition:
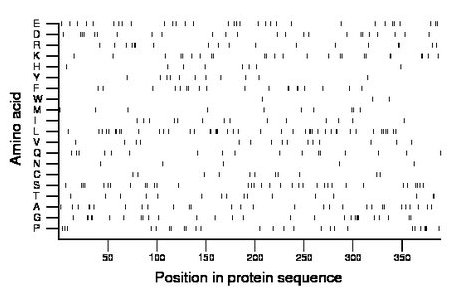
Amino acid Percentage Count Longest homopolymer A alanine 7.5 29 2 C cysteine 2.8 11 1 D aspartate 6.2 24 1 E glutamate 8.2 32 1 F phenylalanine 4.9 19 2 G glycine 7.2 28 3 H histidine 2.1 8 1 I isoleucine 3.6 14 1 K lysine 6.4 25 2 L leucine 11.3 44 3 M methionine 2.6 10 1 N asparagine 1.3 5 1 P proline 6.7 26 3 Q glutamine 4.4 17 1 R arginine 4.6 18 2 S serine 8.7 34 1 T threonine 4.1 16 2 V valine 3.9 15 1 W tryptophan 0.8 3 1 Y tyrosine 2.8 11 1 |
Comparative genomics:
Search single species RefSeq proteins at NCBI
Search summary 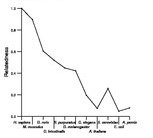
Figure data | ||
Related human proteins:Protein Relative score Description Self-match 1.000 sirtuin 2 isoform 1 SIRT2 0.904 sirtuin 2 isoform 2 SIRT3 0.343 sirtuin 3 isoform a SIRT3 0.319 sirtuin 3 isoform b SIRT1 0.237 sirtuin 1 isoform a SIRT1 0.185 sirtuin 1 isoform b SIRT4 0.063 sirtuin 4 SIRT6 0.061 sirtuin 6 SIRT5 0.056 sirtuin 5 isoform 2 SIRT5 0.055 sirtuin 5 isoform 1 SIRT7 0.048 sirtuin 7 DCAF5 0.012 WD repeat domain 22 TLE2 0.009 transducin-like enhancer protein 2 isoform 2 TLE2 0.009 transducin-like enhancer protein 2 isoform 1 LOC100290265 0.007 PREDICTED: hypothetical protein XP_002346787 SYMPK 0.007 symplekin HCN2 0.007 hyperpolarization activated cyclic nucleotide-gated... RSL1D1 0.007 ribosomal L1 domain containing 1 PALM 0.007 paralemmin isoform 2 PALM 0.007 paralemmin isoform 1 TIGD4 0.007 tigger transposable element derived 4 KIAA1543 0.005 NEZHA isoform 2 KIAA1543 0.005 NEZHA isoform 1 SPEG 0.005 SPEG complex locus GTPBP1 0.005 GTP binding protein 1 GFRAL 0.005 GDNF family receptor alpha likeHuman BLASTP results (used to prepare the table) | |||
Gene descriptions are from NCBI RefSeq. Search results were obtained with NCBI BLAST and RefSeq entries. When identical proteins are present, the self-match may not be listed first in BLASTP output. In such cases, the table above has been reordered to place it first.
See About the Figures for the scoring system used in the figure above right. The same scoring system was used in the table of BLASTP results.
Guide to the Human Genome
Copyright © 2010 by Stewart Scherer. All rights reserved.
