
| Name: MYO1G | Sequence: fasta or formatted (1018aa) | NCBI GI: 239582755 | |
|
Description: myosin IG
|
Referenced in:
| ||
|
Composition:
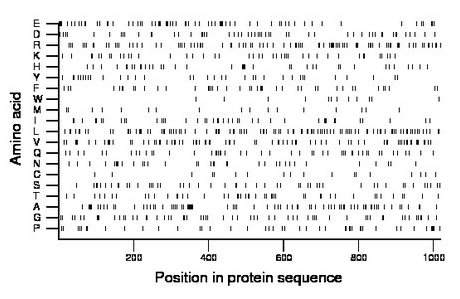
Amino acid Percentage Count Longest homopolymer A alanine 8.0 81 2 C cysteine 1.8 18 1 D aspartate 5.2 53 2 E glutamate 6.8 69 2 F phenylalanine 4.1 42 1 G glycine 6.1 62 2 H histidine 3.8 39 2 I isoleucine 4.0 41 2 K lysine 4.1 42 1 L leucine 10.7 109 3 M methionine 1.8 18 1 N asparagine 3.3 34 2 P proline 4.5 46 2 Q glutamine 4.8 49 2 R arginine 9.4 96 2 S serine 5.1 52 2 T threonine 4.5 46 1 V valine 7.4 75 2 W tryptophan 1.2 12 1 Y tyrosine 3.3 34 1 |
Comparative genomics:
Search single species RefSeq proteins at NCBI
Search summary 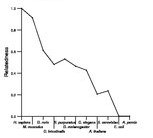
Figure data | ||
Related human proteins:Protein Relative score Description Self-match 1.000 myosin IG MYO1D 0.597 myosin ID MYO1A 0.315 myosin IA MYO1C 0.311 myosin IC isoform b MYO1C 0.311 myosin IC isoform a MYO1C 0.311 myosin IC isoform c MYO1B 0.305 myosin IB isoform 1 MYO1B 0.305 myosin IB isoform 2 MYO1B 0.305 myosin IB isoform 1 MYO1H 0.288 myosin 1H MYO1E 0.248 myosin IE MYO1F 0.237 myosin IF MYO7A 0.207 myosin VIIA isoform 2 MYO7A 0.207 myosin VIIA isoform 3 MYO7A 0.207 myosin VIIA isoform 1 MYO15A 0.206 myosin XV MYO10 0.198 myosin X MYO7B 0.197 myosin VIIB MYH11 0.193 smooth muscle myosin heavy chain 11 isoform SM1A [Ho... MYH11 0.193 smooth muscle myosin heavy chain 11 isoform SM2A [Ho... MYH10 0.193 myosin, heavy polypeptide 10, non-muscle MYO5A 0.193 myosin VA isoform 2 MYO5A 0.193 myosin VA isoform 1 MYH11 0.192 smooth muscle myosin heavy chain 11 isoform SM1B [Ho... MYH11 0.192 smooth muscle myosin heavy chain 11 isoform SM2B [Ho... MYH9 0.190 myosin, heavy polypeptide 9, non-muscle MYH14 0.188 myosin, heavy chain 14 isoform 2 MYO5C 0.187 myosin VC MYH14 0.186 myosin, heavy chain 14 isoform 1 MYO5B 0.186 myosin VBHuman BLASTP results (used to prepare the table) | |||
Gene descriptions are from NCBI RefSeq. Search results were obtained with NCBI BLAST and RefSeq entries. When identical proteins are present, the self-match may not be listed first in BLASTP output. In such cases, the table above has been reordered to place it first.
See About the Figures for the scoring system used in the figure above right. The same scoring system was used in the table of BLASTP results.
Guide to the Human Genome
Copyright © 2010 by Stewart Scherer. All rights reserved.
