| Name: LOC100292713 | Sequence: fasta or formatted (522aa) | NCBI GI: 239756135 | |
|
Description: PREDICTED: similar to AGAP002076-PA
| Not currently referenced in the text | ||
|
Composition:

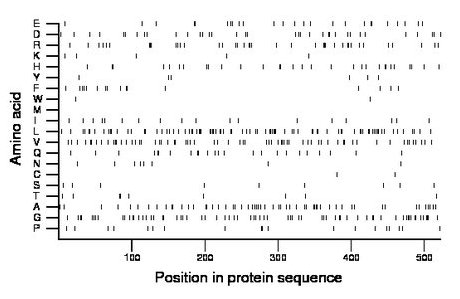
Amino acid Percentage Count Longest homopolymer A alanine 10.7 56 2 C cysteine 0.4 2 1 D aspartate 6.7 35 2 E glutamate 4.8 25 2 F phenylalanine 3.1 16 1 G glycine 13.4 70 3 H histidine 5.7 30 2 I isoleucine 3.4 18 1 K lysine 1.0 5 1 L leucine 16.1 84 2 M methionine 0.2 1 1 N asparagine 1.5 8 1 P proline 3.6 19 2 Q glutamine 4.6 24 2 R arginine 7.5 39 3 S serine 1.7 9 1 T threonine 1.7 9 2 V valine 12.3 64 2 W tryptophan 0.4 2 1 Y tyrosine 1.1 6 1 |
Comparative genomics:
Search single species RefSeq proteins at NCBI
Search summary 
Figure data | ||
Related human proteins:Protein Relative score Description Self-match 1.000 PREDICTED: similar to AGAP002076-PA LOC100291037 1.000 PREDICTED: hypothetical protein XP_002347503 LOC100287214 1.000 PREDICTED: hypothetical protein XP_002343322 ATP5A1 0.009 ATP synthase, H+ transporting, mitochondrial F1 comp... ATP5A1 0.009 ATP synthase, H+ transporting, mitochondrial F1 compl... LOC100290946 0.009 PREDICTED: hypothetical protein XP_002347121 LOC100288840 0.009 PREDICTED: hypothetical protein XP_002344246 LOC100293110 0.008 PREDICTED: hypothetical protein SLC12A7 0.008 solute carrier family 12 (potassium/chloride transp... LOC100128598 0.007 PREDICTED: hypothetical protein LOC100128598 0.007 PREDICTED: hypothetical protein LOC100128598 0.007 PREDICTED: hypothetical protein LOC728767 0.006 PREDICTED: hypothetical protein LOC728767 0.006 PREDICTED: hypothetical protein LOC100292049 0.006 PREDICTED: hypothetical protein XP_002344884 LOC100289438 0.006 PREDICTED: hypothetical protein XP_002343385 E4F1 0.006 p120E4F CEACAM1 0.005 carcinoembryonic antigen-related cell adhesion molec... LOC100129169 0.005 PREDICTED: hypothetical protein LOC100129169 0.005 PREDICTED: hypothetical protein LOC100129169 0.005 PREDICTED: hypothetical protein C12orf69 0.004 hypothetical protein LOC440087Human BLASTP results (used to prepare the table) | |||
Gene descriptions are from NCBI RefSeq. Search results were obtained with NCBI BLAST and RefSeq entries. When identical proteins are present, the self-match may not be listed first in BLASTP output. In such cases, the table above has been reordered to place it first.
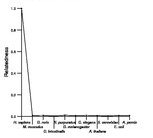
See About the Figures for the scoring system used in the figure above right. The same scoring system was used in the table of BLASTP results.
Guide to the Human Genome
Copyright © 2010 by Stewart Scherer. All rights reserved.
