| Name: DLK2 | Sequence: fasta or formatted (383aa) | NCBI GI: 45593147 | |
|
Description: EGF-like-domain, multiple 9
|
Referenced in:
| ||
Other entries for this name:
alt mRNA [383aa] EGF-like-domain, multiple 9 | |||
|
Composition:

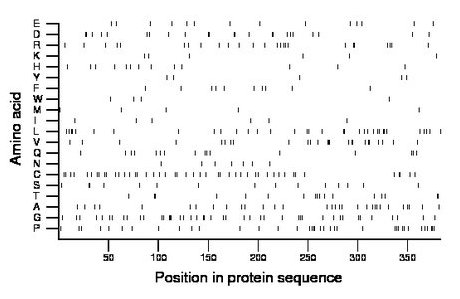
Amino acid Percentage Count Longest homopolymer A alanine 8.1 31 2 C cysteine 12.0 46 2 D aspartate 6.0 23 2 E glutamate 3.7 14 1 F phenylalanine 2.6 10 1 G glycine 11.5 44 3 H histidine 3.4 13 1 I isoleucine 1.6 6 1 K lysine 1.6 6 1 L leucine 8.9 34 2 M methionine 1.3 5 1 N asparagine 1.8 7 1 P proline 9.7 37 2 Q glutamine 4.2 16 1 R arginine 6.5 25 2 S serine 3.9 15 2 T threonine 4.4 17 2 V valine 6.5 25 3 W tryptophan 1.0 4 1 Y tyrosine 1.3 5 1 |
Comparative genomics:
Search single species RefSeq proteins at NCBI
Search summary 
Figure data | ||
Related human proteins:Protein Relative score Description Self-match 1.000 EGF-like-domain, multiple 9 DLK2 1.000 EGF-like-domain, multiple 9 DLL1 0.264 delta-like 1 DLK1 0.259 delta-like 1 homolog JAG2 0.258 jagged 2 isoform b precursor DLL4 0.242 delta-like 4 protein precursor JAG2 0.242 jagged 2 isoform a precursor JAG1 0.240 jagged 1 precursor NOTCH2 0.217 notch 2 preproprotein NOTCH1 0.203 notch1 preproprotein NOTCH3 0.193 Notch homolog 3 SVEP1 0.192 polydom CRB1 0.191 crumbs homolog 1 precursor DLL3 0.182 delta-like 3 protein isoform 1 precursor DLL3 0.182 delta-like 3 protein isoform 2 precursor CRB2 0.173 crumbs homolog 2 NOTCH4 0.167 notch4 preproprotein SLIT2 0.152 slit homolog 2 SLIT1 0.150 slit homolog 1 SNED1 0.149 6720455I24Rik homolog EYS 0.146 eyes shut homolog isoform 1 SLIT3 0.135 slit homolog 3 DNER 0.132 delta-notch-like EGF repeat-containing transmembran... PEAR1 0.121 platelet endothelial aggregation receptor 1 NOTCH2NL 0.120 Notch homolog 2 N-terminal like protein FAT4 0.115 FAT tumor suppressor homolog 4 FAT1 0.115 FAT tumor suppressor 1 precursor VWDE 0.107 von Willebrand factor D and EGF domains TNXB 0.098 tenascin XB isoform 1 precursor TNC 0.094 tenascin C precursorHuman BLASTP results (used to prepare the table) | |||
Gene descriptions are from NCBI RefSeq. Search results were obtained with NCBI BLAST and RefSeq entries. When identical proteins are present, the self-match may not be listed first in BLASTP output. In such cases, the table above has been reordered to place it first.
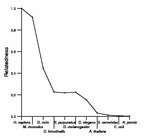
See About the Figures for the scoring system used in the figure above right. The same scoring system was used in the table of BLASTP results.
Guide to the Human Genome
Copyright © 2010 by Stewart Scherer. All rights reserved.
