| Name: PRSS33 | Sequence: fasta or formatted (280aa) | NCBI GI: 117956391 | |
|
Description: protease, serine, 33
|
Referenced in:
| ||
|
Composition:

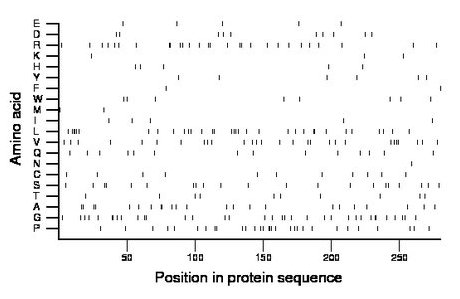
Amino acid Percentage Count Longest homopolymer A alanine 8.2 23 2 C cysteine 3.9 11 1 D aspartate 3.6 10 1 E glutamate 1.8 5 1 F phenylalanine 0.7 2 1 G glycine 12.5 35 2 H histidine 1.8 5 1 I isoleucine 1.8 5 1 K lysine 1.1 3 1 L leucine 11.8 33 4 M methionine 0.7 2 1 N asparagine 0.4 1 1 P proline 10.7 30 3 Q glutamine 5.0 14 1 R arginine 10.0 28 2 S serine 7.5 21 2 T threonine 3.6 10 1 V valine 10.0 28 2 W tryptophan 2.9 8 1 Y tyrosine 2.1 6 1 |
Comparative genomics:
Search single species RefSeq proteins at NCBI
Search summary 
Figure data | ||
Related human proteins:Protein Relative score Description Self-match 1.000 protease, serine, 33 PRSS8 0.412 prostasin preproprotein PRSS27 0.407 marapsin PRSS22 0.389 protease, serine, 22 PRSS36 0.364 protease, serine, 36 TPSG1 0.357 transmembrane tryptase preproprotein TMPRSS6 0.350 transmembrane protease, serine 6 TPSAB1 0.341 tryptase alpha/beta 1 precursor TPSB2 0.339 tryptase beta 2 precursor HPN 0.316 hepsin HPN 0.316 hepsin ESSPL 0.300 epidermis-specific serine protease-like protein [Ho... KLKB1 0.300 plasma kallikrein B1 precursor TESSP1 0.298 testis-specific serine protease 1 TMPRSS5 0.298 transmembrane protease, serine 5 TMPRSS9 0.297 transmembrane protease, serine 9 PLG 0.291 plasminogen PRSS21 0.291 testisin isoform 2 PRSS21 0.290 testisin isoform 1 TMPRSS3 0.282 transmembrane protease, serine 3 isoform 1 TMPRSS4 0.281 transmembrane protease, serine 4 isoform 3 TMPRSS4 0.281 transmembrane protease, serine 4 isoform 1 TMPRSS11D 0.279 transmembrane protease, serine 11D TMPRSS11F 0.277 transmembrane protease, serine 11F TMPRSS13 0.277 transmembrane protease, serine 13 MPN2 0.277 marapsin 2 TMPRSS2 0.275 transmembrane protease, serine 2 isoform 1 TMPRSS2 0.275 transmembrane protease, serine 2 isoform 2 PRSS7 0.270 enterokinase precursor F11 0.268 coagulation factor XI precursorHuman BLASTP results (used to prepare the table) | |||
Gene descriptions are from NCBI RefSeq. Search results were obtained with NCBI BLAST and RefSeq entries. When identical proteins are present, the self-match may not be listed first in BLASTP output. In such cases, the table above has been reordered to place it first.
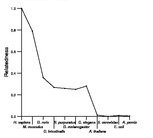
See About the Figures for the scoring system used in the figure above right. The same scoring system was used in the table of BLASTP results.
Guide to the Human Genome
Copyright © 2010 by Stewart Scherer. All rights reserved.
