| Name: UBN2 | Sequence: fasta or formatted (1347aa) | NCBI GI: 236459851 | |
|
Description: ubinuclein 2
|
Referenced in:
| ||
|
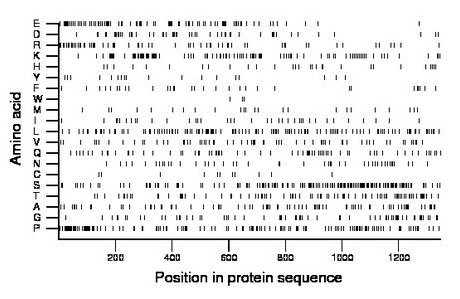
Composition:

Amino acid Percentage Count Longest homopolymer A alanine 6.9 93 4 C cysteine 0.8 11 1 D aspartate 4.2 57 3 E glutamate 6.4 86 2 F phenylalanine 2.4 33 2 G glycine 5.2 70 2 H histidine 2.3 31 2 I isoleucine 2.7 37 1 K lysine 8.1 109 4 L leucine 9.8 132 3 M methionine 1.9 25 1 N asparagine 3.5 47 2 P proline 10.8 146 4 Q glutamine 5.0 68 2 R arginine 4.5 61 3 S serine 12.2 165 4 T threonine 6.5 88 3 V valine 5.0 67 2 W tryptophan 0.2 3 1 Y tyrosine 1.3 18 1 |
Comparative genomics:
Search single species RefSeq proteins at NCBI
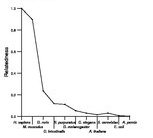
Search summary 
Figure data | ||
Related human proteins:Protein Relative score Description Self-match 1.000 ubinuclein 2 UBN1 0.220 ubinuclein 1 UBN1 0.220 ubinuclein 1 MUC17 0.023 mucin 17 MUC21 0.022 mucin 21 MUC4 0.022 mucin 4 isoform a MUC16 0.020 mucin 16 MUC12 0.019 PREDICTED: mucin 12 MUC12 0.018 PREDICTED: mucin 12 MUC12 0.017 PREDICTED: mucin 12 SRCAP 0.017 Snf2-related CBP activator protein MUC2 0.017 mucin 2 precursor MUC6 0.016 mucin 6, gastric MLL4 0.016 myeloid/lymphoid or mixed-lineage leukemia 4 LOC100131514 0.015 PREDICTED: similar to hCG1747327, partial LOC100133714 0.015 PREDICTED: similar to Mucin-12, partial MUC12 0.015 PREDICTED: mucin 12, cell surface associated KIAA0182 0.015 genetic suppressor element 1 isoform 2 KIAA0182 0.015 genetic suppressor element 1 isoform 1 ATN1 0.014 atrophin-1 ATN1 0.014 atrophin-1 C13orf23 0.014 hypothetical protein LOC80209 isoform 2 C13orf23 0.014 hypothetical protein LOC80209 isoform 1 PRR12 0.014 proline rich 12 MUC5AC 0.014 mucin 5AC FLJ22184 0.013 PREDICTED: hypothetical protein FLJ22184 SETD1B 0.013 SET domain containing 1B POM121C 0.013 POM121 membrane glycoprotein (rat)-like LOC284297 0.013 hypothetical protein LOC284297 LOC645529 0.013 PREDICTED: similar to Putative acrosin-like proteas...Human BLASTP results (used to prepare the table) | |||
Gene descriptions are from NCBI RefSeq. Search results were obtained with NCBI BLAST and RefSeq entries. When identical proteins are present, the self-match may not be listed first in BLASTP output. In such cases, the table above has been reordered to place it first.
See About the Figures for the scoring system used in the figure above right. The same scoring system was used in the table of BLASTP results.
Guide to the Human Genome
Copyright © 2010 by Stewart Scherer. All rights reserved.
