| Name: FZD1 | Sequence: fasta or formatted (647aa) | NCBI GI: 4503825 | |
|
Description: frizzled 1
|
Referenced in:
| ||
|
Composition:

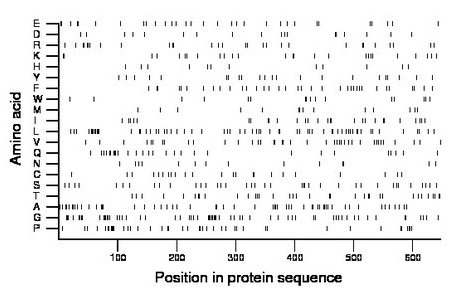
Amino acid Percentage Count Longest homopolymer A alanine 8.5 55 2 C cysteine 3.6 23 2 D aspartate 2.8 18 1 E glutamate 5.1 33 3 F phenylalanine 5.6 36 2 G glycine 10.0 65 4 H histidine 1.9 12 1 I isoleucine 4.3 28 2 K lysine 4.0 26 2 L leucine 10.2 66 5 M methionine 2.3 15 2 N asparagine 2.2 14 2 P proline 7.0 45 5 Q glutamine 4.6 30 4 R arginine 4.8 31 3 S serine 5.9 38 2 T threonine 5.4 35 2 V valine 6.0 39 2 W tryptophan 2.5 16 2 Y tyrosine 3.4 22 1 |
Comparative genomics:
Search single species RefSeq proteins at NCBI
Search summary 
Figure data | ||
Related human proteins:Protein Relative score Description Self-match 1.000 frizzled 1 FZD7 0.674 frizzled 7 FZD2 0.674 frizzled 2 FZD5 0.373 frizzled 5 precursor FZD8 0.364 frizzled 8 FZD10 0.356 frizzled 10 FZD3 0.344 frizzled 3 FZD6 0.329 frizzled 6 FZD9 0.318 frizzled 9 FZD4 0.317 frizzled 4 SMO 0.127 smoothened FRZB 0.075 frizzled-related protein SFRP4 0.072 secreted frizzled-related protein 4 SFRP2 0.060 secreted frizzled-related protein 2 precursor SFRP5 0.059 secreted frizzled-related protein 5 SFRP1 0.059 secreted frizzled-related protein 1 CORIN 0.054 corin MFRP 0.038 membrane frizzled-related protein CPZ 0.029 carboxypeptidase Z isoform 1 CPZ 0.029 carboxypeptidase Z isoform 2 precursor COL18A1 0.017 alpha 1 type XVIII collagen isoform 3 precursor [Ho... LOC100290189 0.014 PREDICTED: hypothetical protein XP_002347700 LOC100289086 0.014 PREDICTED: hypothetical protein XP_002344149 LMTK3 0.009 lemur tyrosine kinase 3 C6orf174 0.009 hypothetical protein LOC387104 FNTA 0.009 farnesyltransferase, CAAX box, alpha isoform c [Homo... FNTA 0.009 farnesyltransferase, CAAX box, alpha isoform a KIAA1602 0.009 hypothetical protein LOC57701 TAF4 0.008 TBP-associated factor 4 SMARCA4 0.008 SWI/SNF-related matrix-associated actin-dependent r...Human BLASTP results (used to prepare the table) | |||
Gene descriptions are from NCBI RefSeq. Search results were obtained with NCBI BLAST and RefSeq entries. When identical proteins are present, the self-match may not be listed first in BLASTP output. In such cases, the table above has been reordered to place it first.
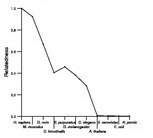
See About the Figures for the scoring system used in the figure above right. The same scoring system was used in the table of BLASTP results.
Guide to the Human Genome
Copyright © 2010 by Stewart Scherer. All rights reserved.
